Trend or Strategy? What's Driving Growth on College Platforms
A few years ago, the era of investing in websites seemed over as branding switched to social media as the future of communication.
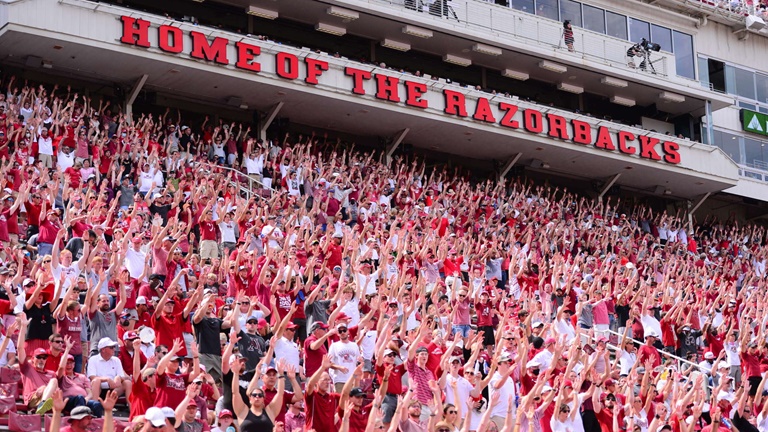
However, for some forward-leaning college sports teams, such as Florida State, Iowa, and Arkansas, the tide is shifting. WMT, which powers the websites for 12 Power Five athletic departments as well as working with 20-plus Division I schools and conferences, partners collectively experienced a significant surge in traffic to their official athletic websites during the 2021 football and 2021-22 men’s and women’s basketball seasons.
In the era of Tik Tok, Meta and all the other aggregation platforms, how is this possible? Is this a micro-trend or emblematic of a greater shift in strategy?
Let’s dive deeper into the numbers.
Analyzing the data
We could have compared our partners to the pandemic year of 2020-21. For just about every company not named Netflix, website traffic was down. In this academic year, however, it more than doubled.
So, we threw out the pandemic year. It was an outlier and hopefully will stay that way.
We benchmarked our partners against the 2019 football season and 2019-20 men’s and women’s basketball seasons.
Collectively, our Power 5 partners increased significantly. The football results include:
● 17% increase in page views
● 21.98% in number of sessions
● 22.83% in in number of users
● 23.9% increase in time spent on page
The basketball season results were similarly impressive:
● 38.9% increase in page views
● 30.6% increase in sessions
● 23% increase in users
● 2.7% decrease in time spent on page
Now, let's tackle a few of the potential factors for the growth.
Was this just driven by football success from Ohio State, Notre Dame, and Clemson in 2021?
No. In fact, 2021 was the first time in CFP history that none of the three powerhouse programs were in the playoffs, while all three made the 2019 playoffs, joining LSU.
Kansas just won the 2022 Division I Basketball National Championship, was that the reason for the growth in hoops?
Winning certainly helped. KU, Arkansas, and Miami had banner seasons with captivating March Madness runs. However, Virginia, Clemson, Georgia Tech, Iowa, Ohio State and Notre Dame had various levels of success, but nothing compared to previous successes in the NCAA tournament.
Is social media the driving force for all this traffic to their websites?
Direct traffic from social platforms peaked years ago, and while it is a relevant input, those platforms are not incentivized to drive traffic to an official athletic website. At this point, the algorithms and best practices are blatantly clear.
Is it possible there is something more strategic behind the growth?
During the last 10 years, there was a regular belief that the need for a website would cede importance to social media.
That model has turned, at least with WMT’s partners, which have realized and embraced the value in owned platforms that are customized to their brands. For example, Clemson. The Tigers led much of the social media recruiting and brand-building trends in college athletics over the last decade. Yet this winter, the university launched a stand-alone premium content subscription platform, Clemson+. Clemson led the social media craze and is now leading the direct-to-consumer strategy.
What’s the goal?
“Having everything in one place is going to make it so much easier for the fans to find,” said former Clemson creative leader and current consultant Jonathan Gantt in a recent SBJ article.
To the WMT team, it’s no surprise that the schools we partner with continue to grow their audience through optimized web experiences. Their web domains were always their digital front door, but they have doubled down on their websites being the hub for their brands. That approach has broadened their funnel for fans, improved their strength on search engines and led to audiences that continue to grow in the good and bad seasons.
Their fans are visiting their sites more often, returning regularly and viewing more pages.
All the statistics are not pointing directly up. As noted above, during basketball season there was a collective decrease of 2.7% for time spent on page. On average, time on page is below a minute per page. It’s increasing but still low. In context, some of that is social media impact and the speed in which users ingest content with a swipe.
But it also signals that college athletic leaders are being thoughtful in meeting user behaviors and habits from social media by presenting in a format and layout that optimizes the speed of consumption.
Schools have been intentional and followed best practices around ease of discovery and ease of use. That has shaped user behaviors in a positive way and made WMT’s partner sites the trusted, go-to source. The time on page may be low, but that’s not a negative factor anymore. The fan is getting their information quickly and returning regularly.
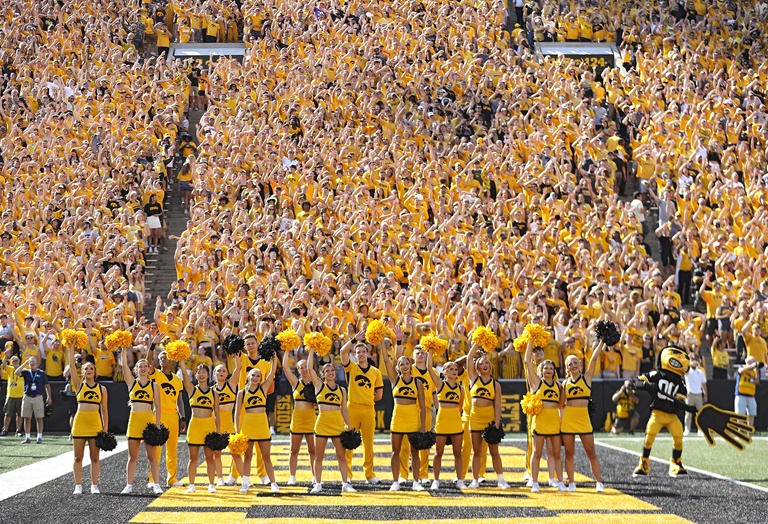
No partner does it better than the Iowa Hawkeyes. How? They have a smaller potential audience than Clemson or Ohio State, but are driving page impressions equal to or better to most blue-blood brands. Even though less fans are visiting their website more than Clemson, they are going deeper and clicking on more pages.
How to increase time on site?
WMT has been on the forefront of launching over-the-top (OTT)/smart TV platforms in the collegiate space. While the data is still in its infancy, the trend could prove to be a solution for a long-term problem in the sports space – how to get fans to watch stories that can only be best told in a longer format.
Notre Dame, Clemson and Miami led the foray into smart TV applications (OTT) during the pandemic. All these brands saw the value of putting their best video content on the largest possible “in-home” screens. Notre Dame was trying to reach its national and international audience, Clemson was trying to replicate the in-person recruiting experience, and Miami was focused on further distribution. All saw a similar trend.
When fans activated an OTT app on Apple TV, AndroidTV, Amazon Fire TV or Roku, it was destination viewing. They were sitting down for big chunks of time to watch the content.
This academic year, the Mountain West Conference, Arkansas, and Oklahoma State have joined the OTT fold. Average viewing time for the Mountain West Conference is over an hour for their live games while Arkansas alone is over 12 minutes (and increasing) for story telling content that generally ranges between 5-10 minutes in length.
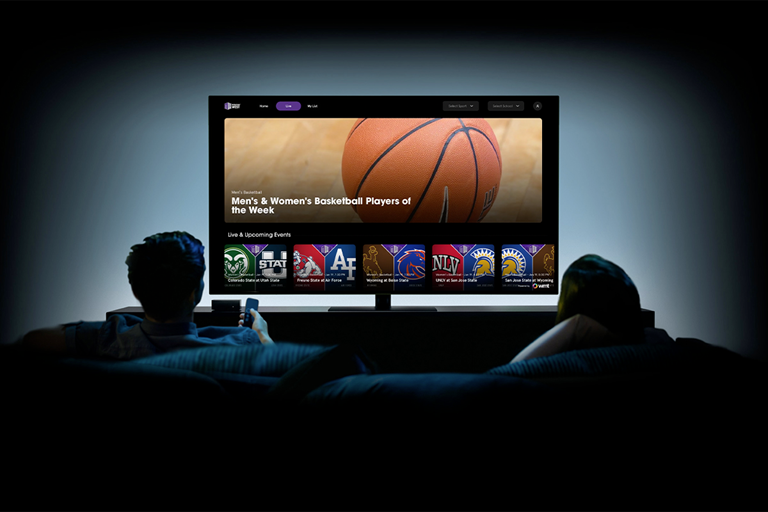
Smart TV app usage is still relatively small in comparison to web and mobile app, but the segment is growing. Watching on a large screen TV still beats a laptop or mobile phone. That’s one thing all sports fans can agree on.
The number of people streaming to TVs more than doubled (115% increase) from 2020 to 2021 and the worldwide market for subscription video on demand is expected to increase 52% by 2025.
In a world where social media has forced most brands to produce shorter and shorter content – and videos in particular – to keep up with the algorithms, there appears to be a solution for getting your fans to settle in for long durations around compelling story telling and live events.
So how do you grow your sports audience in 2022? Where possible, own and control as much of your digital footprint as possible. Operate like a modern media entity with a wheel and spoke approach. Netflix, Disney+ and The Athletic are not giving away their best content on other platforms. They are using those platforms to funnel consumers to their core offering and then making sure they have the information and content that will keep them coming back.

